What Is The Weather Like In The Fjords In Norway?
Fjord weather around Bergen and Vestland explained with Met Norway data: monthly temperatures, rainfall, the 217 days of precipitation figure, and what to pack for a fjord trip.
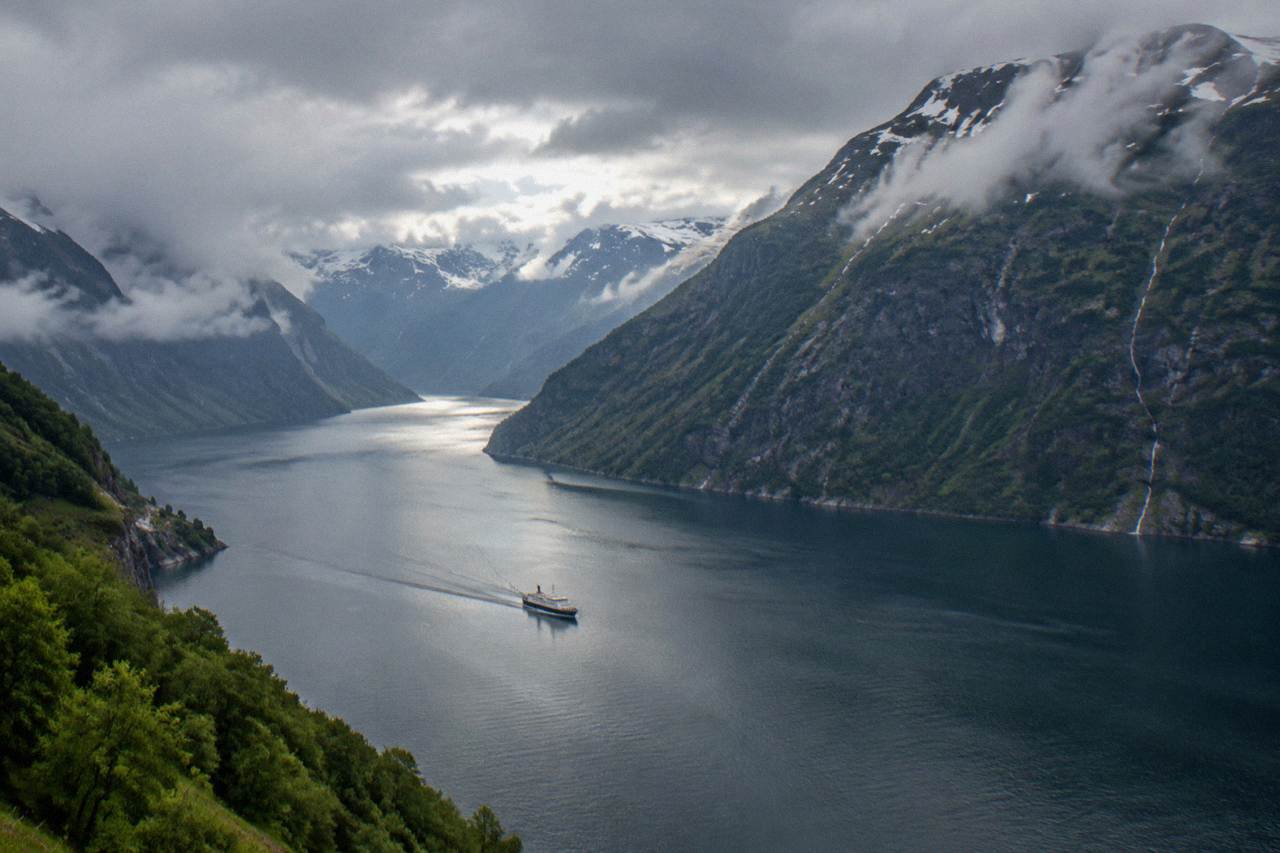
Fjord weather in Norway is mild for its latitude, wet, and famously changeable, and nowhere is that clearer than around Bergen, the old Hanseatic port in Vestland county on Norway's southwestern coast that most fjord trips start from. The city sits at the mouth of a fjord system that funnels North Atlantic weather systems straight into steep-sided valleys, so a single day can move from low cloud on the water to clear sun above the treeline and back again before lunch. This page sets out what the climate actually does, using the official Met Norway statistics for the Bergen station rather than folklore, and translates that into what it means for a fjord trip.
What Is The Weather Like In The Fjords In Norway?
The fjords of western Norway have a temperate oceanic climate: mild winters, cool summers, and rain in every month of the year. yr.no's Bergen station table, which Met Norway supplies, shows observed monthly averages ranging from a January 2026 low of -1.4C to a July 2026 high of 14.9C, with monthly precipitation running from 65.9mm in an unusually dry April to 321.8mm in November. Across the trailing thirteen months the same station recorded 217 days with precipitation.
That last number is the one visitors should take seriously. It does not mean it rains all day, every day. It means that on roughly six days out of ten, some precipitation falls at the station, whether that is a passing shower or a full frontal system parked over the coast for a week. The Bergen weather month by month guide unpacks the same table in more detail for the city itself, and the story it tells is the story of every fjord arm within a day trip of the harbour: wet air arriving from the west, hitting mountains, and dropping its moisture.
The fjords modify their own weather in two directions. Water temperature damps the extremes, which is why a January average of -1.4C is remarkable for a city this far north, at the latitude of Shetland. And the valley walls create local effects: cloud can sit on the water at sea level while the summits above are in sunshine, a pattern anyone who has ridden a cable car or funicular up from Bergen will recognise. The Bergen Travel Guide homepage covers what to do with those summit-clear hours, because they are the hours that matter most on a short trip.
Here is the verified monthly picture from the Bergen station table, trailing thirteen observed months:
| Month | Mean temperature (observed) | Precipitation (observed) |
|---|---|---|
| Aug 2025 | 15.1C | 165.1mm |
| Sep 2025 | 13.1C | 206.6mm |
| Oct 2025 | 9.7C | 231.9mm |
| Nov 2025 | 6.0C | 321.8mm |
| Dec 2025 | 5.8C | 303.5mm |
| Jan 2026 | -1.4C | 82.0mm |
| Feb 2026 | 0.8C | 133.4mm |
| Mar 2026 | 5.9C | 243.9mm |
| Apr 2026 | 7.9C | 65.9mm |
| May 2026 | 9.9C | 127.4mm |
| Jun 2026 | 14.4C | 165.7mm |
| Jul 2026 | 14.9C | 184.2mm |
| Aug 2026 | 14.3C | 243.6mm |
Read the table before drawing conclusions. November is the wettest month shown, at 321.8mm observed against a 275.0mm normal, while the following January delivered only 82mm, far under its own 256mm normal. April 2026 came in at 65.9mm against a 141mm normal. In other words, the normals are one thing and any single month can swing a long way from them, which is the practical definition of fjord weather: plan for the normal, expect the outlier.
How Does Fjord Weather Differ From Bergen City Weather?
Bergen city weather and fjord weather are the same climate system seen from two spots, and the differences are mainly about terrain, not about climate zones. The Bergen station table is the honest proxy for the whole Vestland fjord region: the valleys inland run a touch colder in winter, the exposed outer coast runs a touch windier, and the mountaintops above the fjords are several degrees cooler than the water level in every season. Temperatures at harbour height and summit height on the same day are two different forecasts.
The practical consequences are worth spelling out. A cruise or kayak trip on the fjord water itself happens at sea-level temperatures, which is why swimming in the fjords, a question covered in detail elsewhere on this site, is a bracing proposition even in July. A viewpoint like the Fløyen plateau or the Ulriken summit sits high enough that the summit can be in cloud while the harbour is dry, or in sun while the harbour drips. Anyone booking a summit tour should check the summit forecast, not the city one.
The second difference is timing. Weather systems arrive from the west, so the outer coast catches the front first and the inner fjord arms catch it hours later. A morning of low cloud in Bergen can be the tail end of a front that has already cleared the outer Hardangerfjord, and by afternoon the order reverses. Locals plan around this by holding flexible afternoons rather than fixed mornings, and by treating any long-range forecast as a rumour rather than a promise.
For trips that leave the city entirely, the differences grow. The fjord tours from Bergen guide lists the main corridors, and each has its own micro-pattern: the long Sognefjord arms sit deeper between mountains and feel more sheltered, while the Hardangerfjord's orchard slopes catch afternoon sun in a way the city rarely does. None of this changes the fundamentals. The fundamentals are a wet oceanic climate with no dry season, and every month of the table above confirms it.
If you are weighing how a wet-window day can still be a good fjord day, these are the three tours that handle this region's weather best:
Each of the three works with the weather rather than against it. A food tour keeps you indoors between stops, a night cable car tour turns low cloud into a city-lights asset, and a guided fjord cruise puts you on sheltered water where rain matters far less than it does on an exposed summit.
Which Months Have The Best Weather In The Norwegian Fjords?
The best months for fjord weather around Bergen are June, July and August, which hold the three warmest monthly averages in the Met Norway table at 14.4C, 14.9C and 14.3C, and the period's highest single temperature was 28.0C on 14 August. Late spring, May at 9.9C, is the drier shoulder alternative, with 127.4mm of rain against June's 165.7mm. No month is dry, so "best" means warmest, not rain-free.
May deserves a fuller argument than it usually gets. Its observed precipitation of 127.4mm came in above its own 109mm normal, but that normal is the lowest in the entire table, lower even than the April normal of 141mm. May also sits before the summer crowds on the fjord boats and before the peak prices in the hotels. The trade is temperature: a 9.9C average means a sweater on the water and a jacket at the viewpoints, and the water itself is at its coldest after winter.
Autumn flips the calculation. September 2025 averaged 13.1C, warmer than May, but delivered 206.6mm of rain against May's 127.4mm. October drops to 9.7C and 231.9mm, and from November onward the table turns unambiguously wet and dark, with November's 321.8mm the wettest month shown. The Bergen in autumn and Bergen in spring guides cover both shoulders in depth for the city end of the trips.
Winter is a separate product altogether. January 2026 averaged -1.4C against a 2.6C normal, an unusually cold month, and February recovered to 0.8C. The period's lowest reading, -11.3C on 8 January, shows what the fjord valleys can do when a cold air mass settles in. Days are short, some fjord services reduce their schedules, and the weather window closes early each afternoon. That said, a still winter day on a fjord with snow on the rock faces is one of the region's genuine sights, and the few operators that run through the season price accordingly.
Wondering whether a specific month works for your dates?
The listing shows live availability and current pricing, and bookings on this site's featured tours can generally be cancelled or changed close to the departure date, so a shaky forecast is not a reason to skip booking.
Does It Rain Every Day In The Norwegian Fjords?
No, it does not rain every day: the Bergen station recorded 217 days with precipitation across the trailing thirteen months, which works out to roughly six days in every ten. That figure counts every day with any precipitation at all, from a brief shower to a steady frontal rain, so the honest summary is frequent light rain rather than constant heavy rain, and completely dry stretches of several days do occur, especially around April and May.
The pattern matters more than the total. Frontal systems sweep through fast, and the classic fjord day is a repeating cycle of shower, clearing, shower, clearing. Waterproof jacket discipline, in other words, beats umbrella discipline, because umbrellas lose to the wind that accompanies the fronts. The rainiest month in Bergen answer goes deep on the wet end of the year, and November is the peak of it.
Two practical notes follow from the 217 figure. First, plan at least one indoor-capable activity per day of a fjord trip: a museum, a long lunch, a sauna, a covered boat deck. Second, do not cancel a fjord day on a wet forecast, because the fjord water is the one place where rain genuinely changes least. A cruise along a fjord arm in drizzle, with waterfalls swollen and mist lifting off the rock, is not a consolation prize. It is the landscape the brochures photograph.
For travellers who want the rainiest-hour protection, the covered and sheltered options run year-round:
Guided kayak tours in this region supply the full dry suit and safety kit as part of the package, so a wet day is a normal working day for the guide, not a cancellation trigger.
What Should You Pack For Fjord Weather In Norway?
Pack for layers and waterproofing in every season: a genuinely waterproof shell jacket, warm mid-layers even in summer, and sturdy shoes with grip for wet rock and boardwalk, because a July average of 14.9C is a daytime average, not a promise, and the same thirteen-month period swung between 28.0C and -11.3C. Weather can change by the hour on the water, so the packing rule is: dress for three seasons in one day.
The layering logic is simple. You will alternate between being warm while walking, cold while sitting still on a moving boat, and either while standing at an exposed viewpoint. A base layer, a fleece or wool mid-layer and a shell lets you adjust in seconds, and wool mid-layers are the local preference because wool keeps insulating when the rain finds a gap. Gloves and a hat earn their space even in August on an open deck at speed, and sunglasses do too, because low-angle northern sun off water is genuinely harsh when it appears.
Footwear is the other half of the kit. The stone streets of central Bergen, the timber walkways of the wharf, and the trailheads above the fjords all share one quality: they are slick when wet. A shoe with a real lug sole changes the whole trip. Full waterproof boots matter most from October to March, when the table's precipitation runs 231.9mm, 321.8mm, 303.5mm, 82mm and 243.9mm across the five coldest months.
| Season | Typical daytime range (from Met Norway monthly means) | Packing priority |
|---|---|---|
| Spring (Mar-May) | 5.9C to 9.9C monthly means | Waterproof shell, warm mid-layer, grippy shoes |
| Summer (Jun-Aug) | 14.4C, 14.9C, 14.3C monthly means | Light layers plus shell and warm layer for decks |
| Autumn (Sep-Nov) | 13.1C down to 6.0C monthly means | Full rain kit, wool mid-layers, waterproof boots |
| Winter (Dec-Feb) | 5.8C, -1.4C, 0.8C monthly means | Serious warmth, ice-ready soles, reflective details |
One more packing note that is easy to miss: a dry bag or a good zip-lock for phone and camera. Between the spray on open stretches of fjord and the sheer frequency of showers in a 217-precipitation-day year, electronics get wet on this coast. The cheap precaution saves the expensive device.
For the city days between fjord excursions, food-forward options pair well with showers, since the stops are indoors:
A self-guided audio tour is the other rain-proof format: it runs entirely on your own phone and headphones, ducks into doorways when the sky opens, and costs less than a lunch.
How Does Fjord Weather Shape What You Can Do?
Fjord weather decides your itinerary more than your preferences do: summer averages around 14.9C make water-based trips, cruises, kayaking and swimming, genuinely comfortable, while the 217 precipitation days per year make flexible booking and indoor-capable backups essential in every season, and winter's -1.4C January average 2026 shuts some fjord services down entirely or moves them to reduced schedules.
Start with the water. The fjord cruise is the most weather-tolerant product in the region because the boats run in nearly all conditions and the scenery is arguably better with mist and moving cloud than under flat blue sky. Kayaking is more exposed, so dry suits and guide judgement do the work, and the question of whether you can swim in the fjords, answered in full elsewhere on this site, depends on the season's water temperature more than the day's air temperature.
Next, the viewpoints. Cable cars and funiculars to summits are the most weather-dependent products on offer, because a summit in cloud delivers a white wall instead of a panorama. The trick locals use is to check the summit camera or the forecast for altitude, not street level, before committing. A morning that looks grey in the harbour can be clear at 400 metres, and the reverse happens just as often. Booking a summit trip for the start of your stay rather than the end leaves a retry window.
Then the calendar. If you are choosing a whole month rather than dodging a single forecast, the best month to visit Norway fjords answer breaks the trade in detail, and the cruise-focused version of the same question, what is the best month to cruise Norway fjords, matters if you are arriving by ship. For day trips out of the city, can you do a day trip to the fjords from Bergen covers what is realistic in the hours you actually have.
The three products below are the ones that survive this climate best across the year:
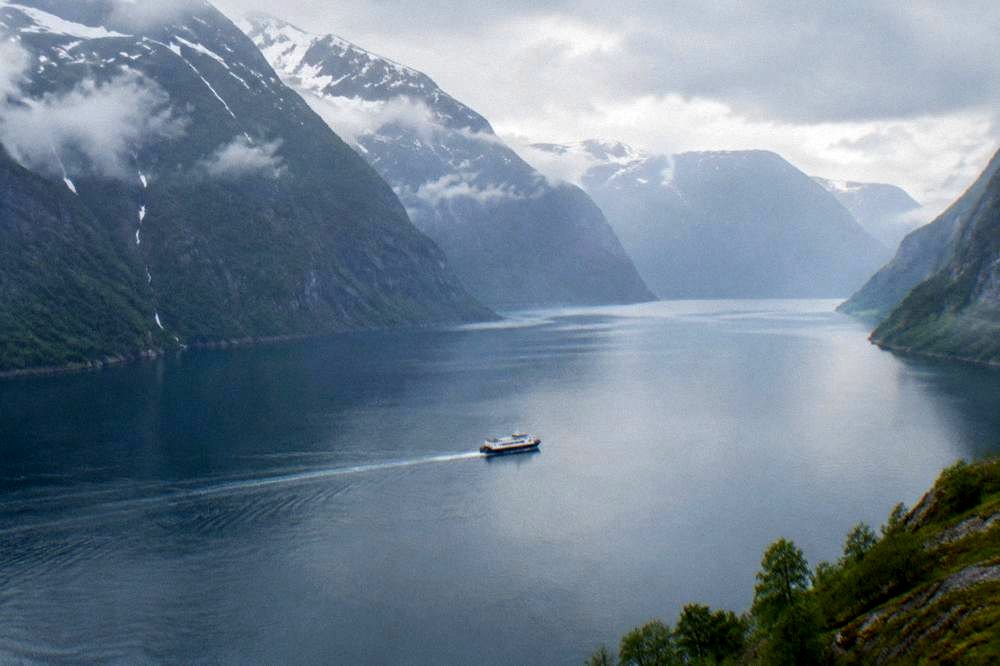
The common thread is simple. Everything on that list either puts you on sheltered water, moves you indoors between the weather's worst moments, or turns the darkness into the attraction. That is how this coast is enjoyed, and it is why the operator's live listing, not a weather app two weeks out, is the final planning tool. Check availability on the days you actually hold, and let the Met Norway table above set your expectations while the day itself sets your route.
Common Questions About Fjord Weather In Norway
What is the weather like in the fjords in Norway?
Temperate oceanic and wet in every month: Met Norway's Bergen station table shows monthly mean temperatures from -1.4C in January 2026 to 14.9C in July 2026, with observed monthly precipitation between 65.9mm and 321.8mm across the trailing thirteen months, and 217 days with precipitation in total.
Is the fjord region colder than Bergen?
Not usually at water level. The fjord arms around Bergen share the same coastal climate, and valley walls can even hold slightly milder air. The summits above the fjords run several degrees colder than the water, and the period's low of -11.3C shows how cold inland valleys can get in a cold snap.
What is the driest month for a fjord trip?
On the normals, May is the driest month in the Met Norway table at 109mm, and April is next at 141mm. Observed months can differ sharply from the normals, though, as April 2026's 65.9mm shows, so treat any single month's forecast as more reliable than the normal.
Does it ever get warm enough to swim in the fjords?
Air temperatures can: the trailing thirteen months peaked at 28.0C. The water warms far more slowly than the air, so swimming in the fjords depends on the season and the specific arm of water, not on the day's temperature alone.
Do I need a waterproof jacket in summer?
Yes. Summer months still recorded 165.7mm, 184.2mm and 243.6mm of precipitation in the observed period, and a moving boat deck adds wind chill to a shower. A shell jacket is a year-round item on this coast.